Plotting distribution of statistic for object "htest"
# S3 method for htest
plot(x, ...)
Arguments
| x | object of class "htest" |
|---|---|
| ... | further arguments to ggplot |
Value
a ggplot or NULL
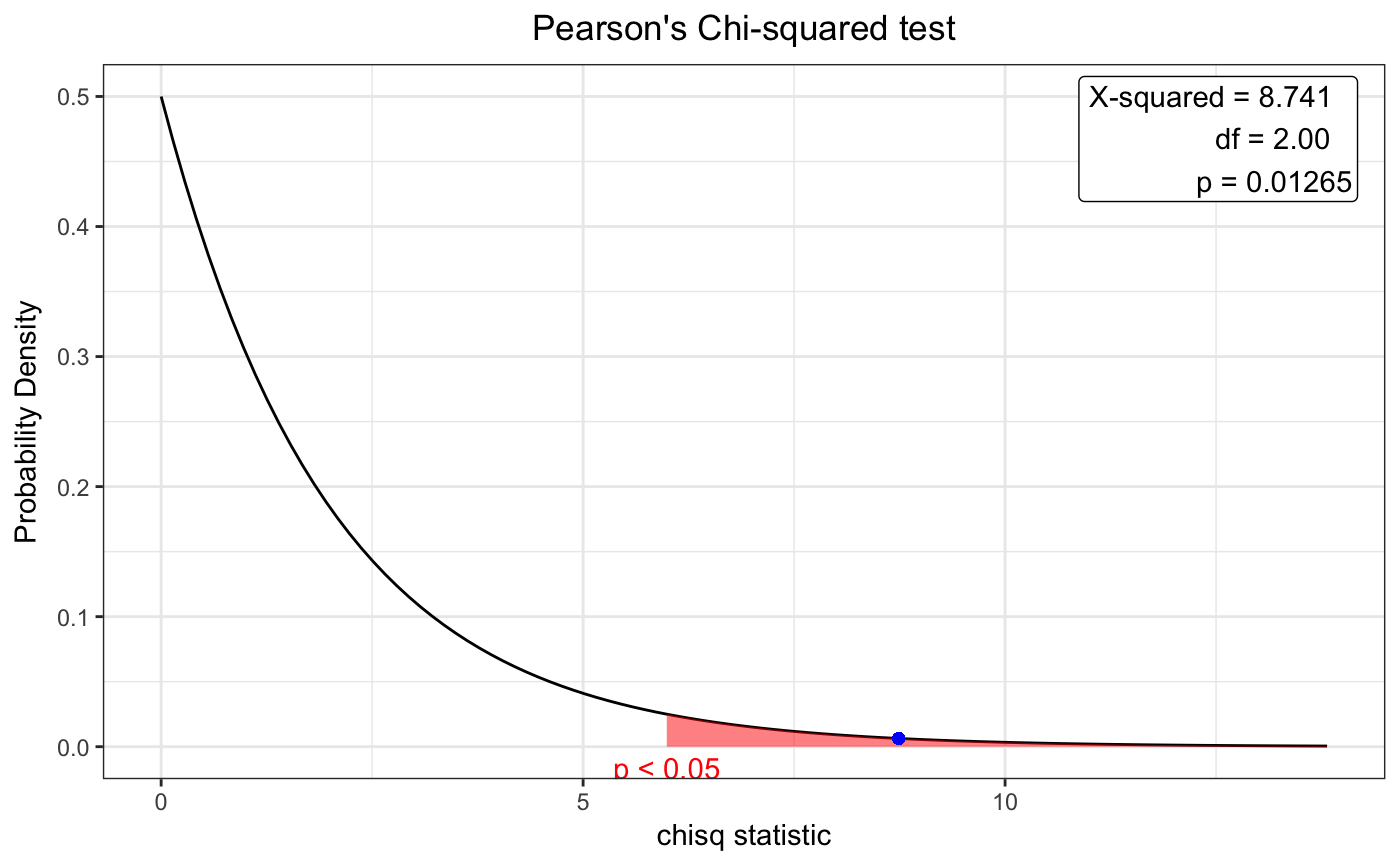
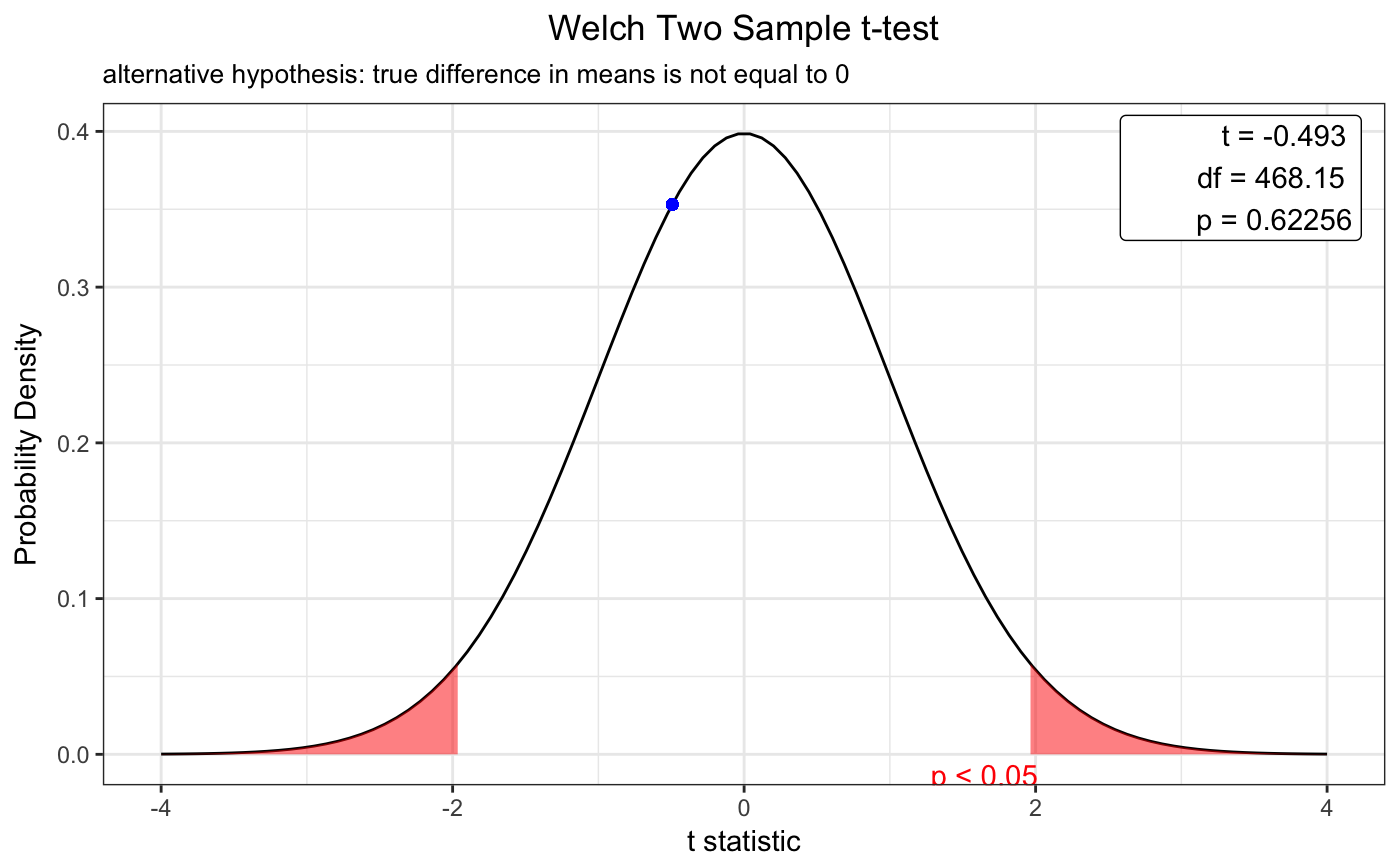
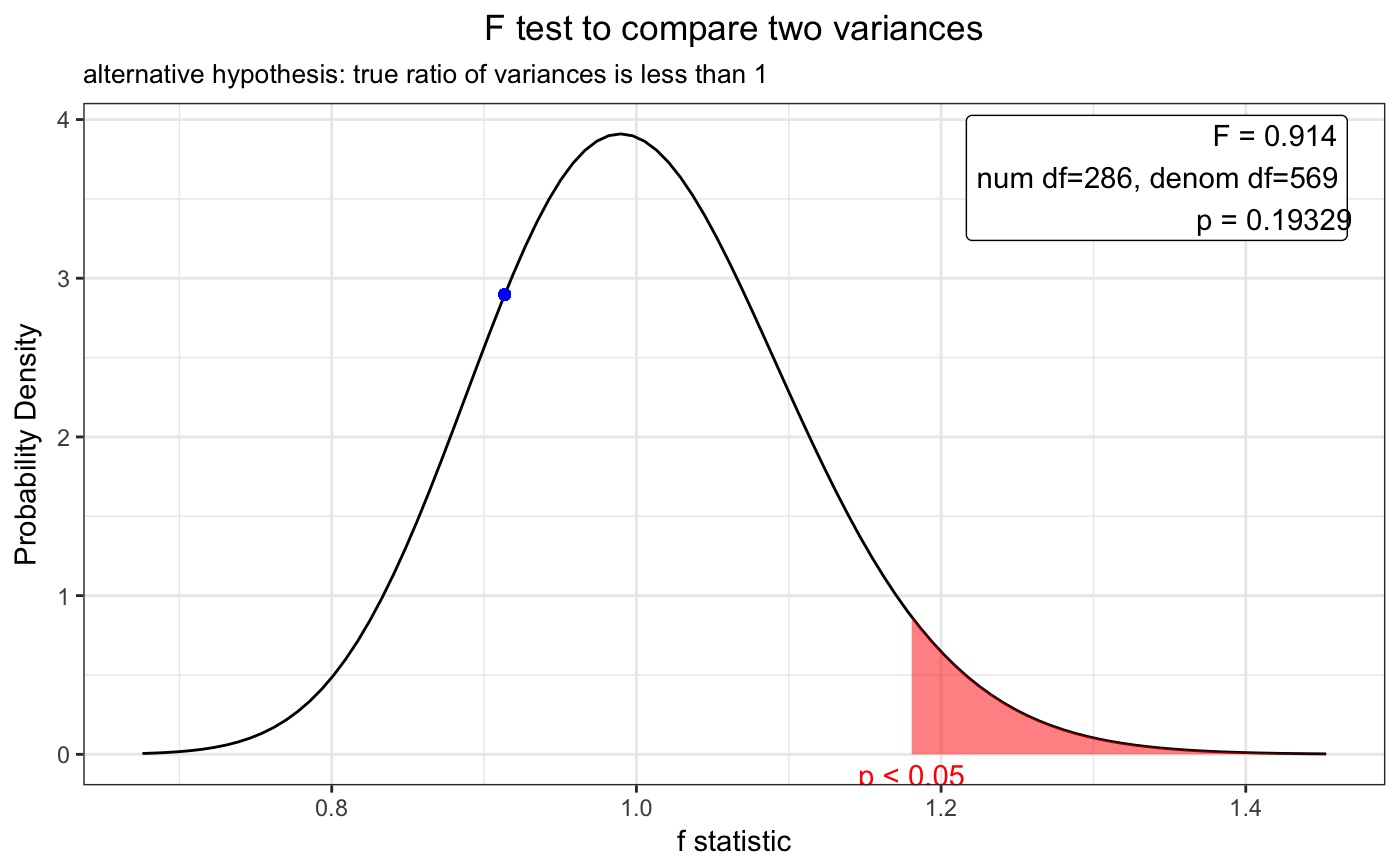
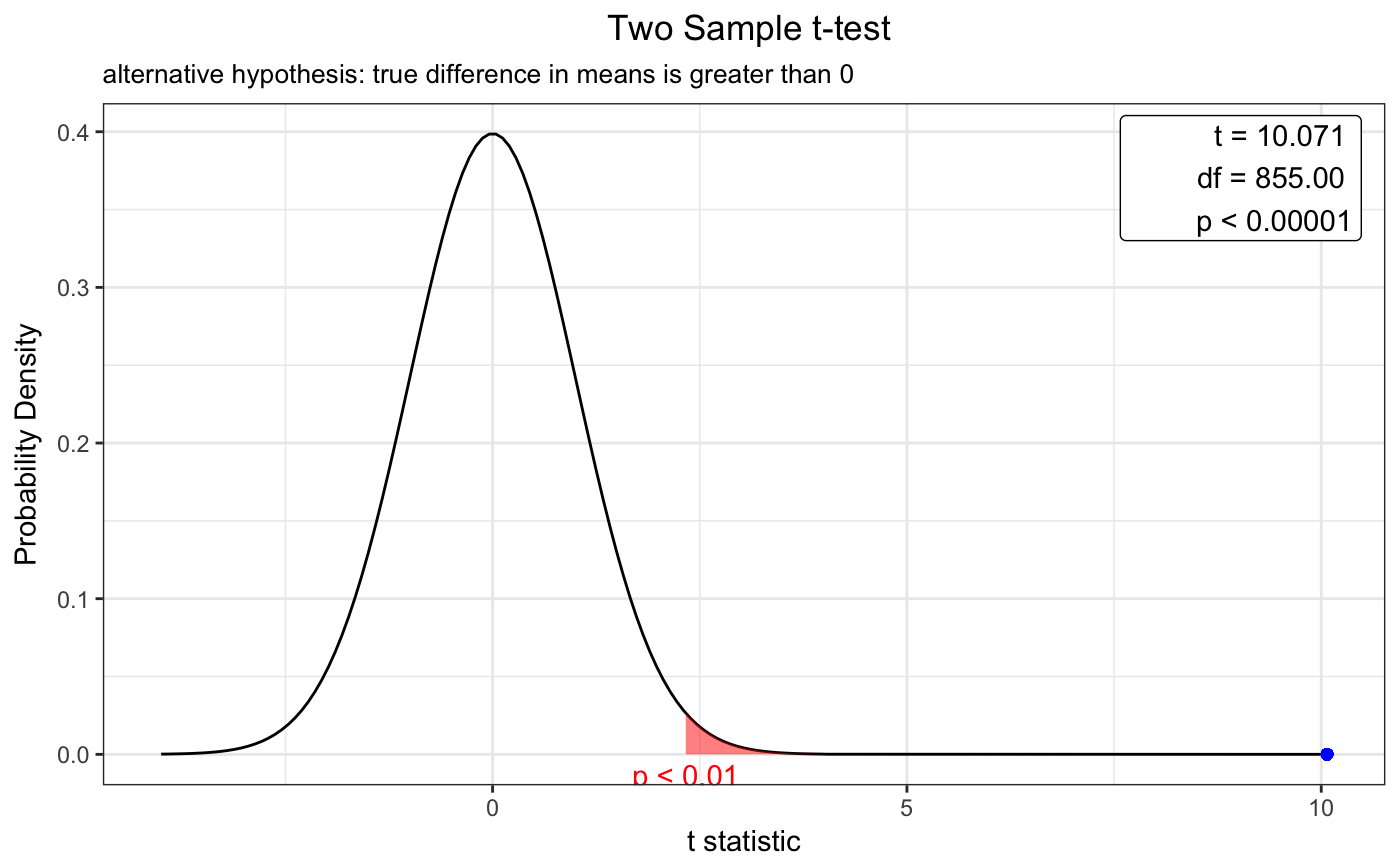
Examples
require(moonBook) require(webr) ## chi-square test x=chisq.test(table(mtcars$am,mtcars$cyl))#> Warning: Chi-squared approximation may be incorrectplot(x)#Welch Two Sample t-test x=t.test(mpg~am,data=mtcars) plot(x)x=t.test(BMI~sex,data=acs) plot(x)# F test to compare two variances x=var.test(age~sex,data=acs,alternative="less") plot(x)# Paired t-test x=t.test(iris$Sepal.Length,iris$Sepal.Width,paired=TRUE) plot(x)# One sample t-test plot(t.test(acs$age,mu=63))# Two sample t-test x=t.test(age~sex, data=acs,conf.level=0.99,alternative="greater",var.equal=TRUE) plot(x)