Draw an Observed vs Expected plot
Usage
OEplot(fit, xnames = NULL, no = 3, maxy.lev = 5, median = TRUE)
Arguments
- fit
An object of class "coxph"
- xnames
Character Names of explanatory variable to plot
- no
integer Number of groups to be made
- maxy.lev
Integer Maximum unique length of a numeric variable to be treated as categorical variables
- median
logical
Value
No return value, called for side effects
Examples
library(survival)
data(cancer,package="survival")
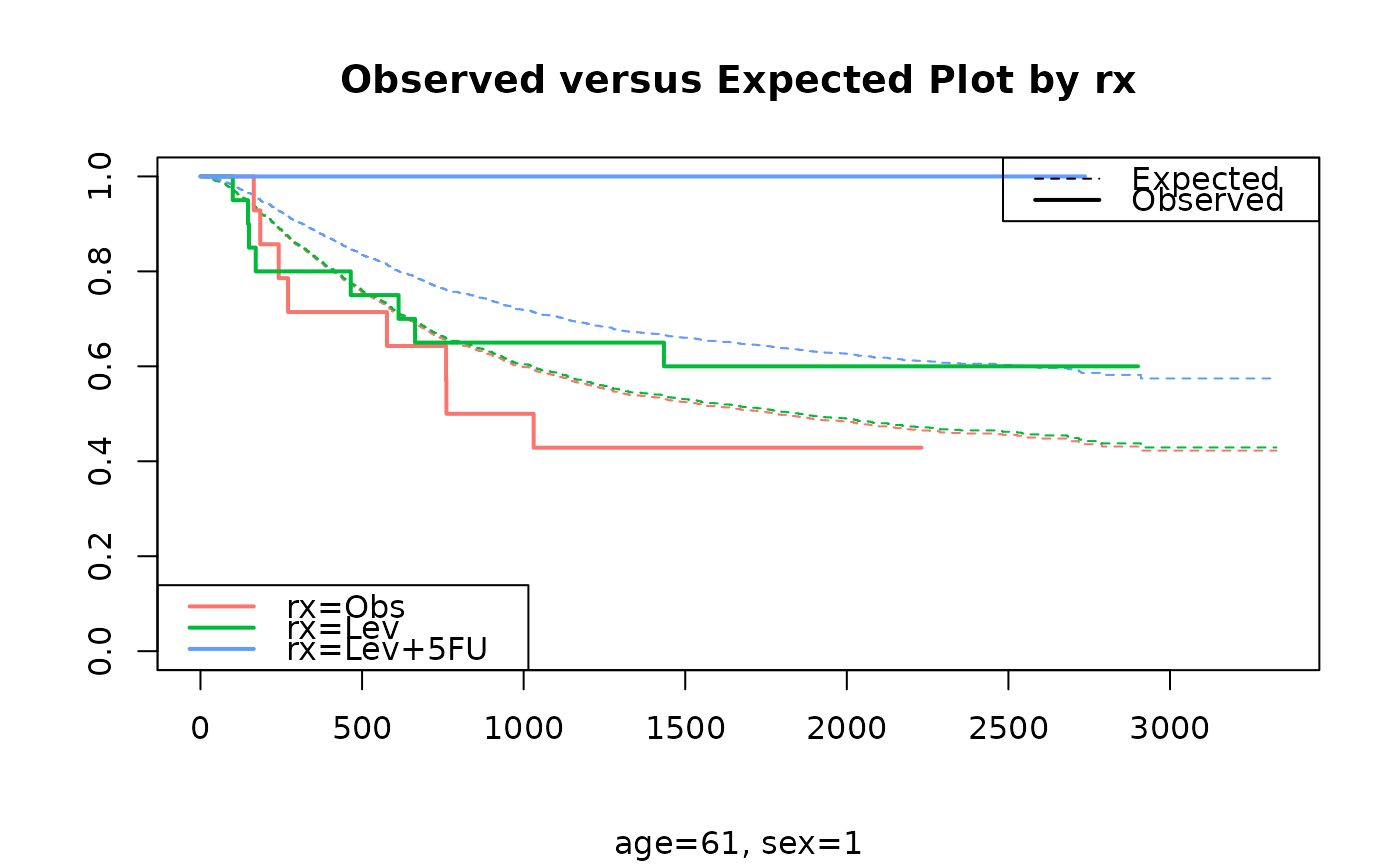
fit=coxph(Surv(time,status)~rx+age+sex,data=colon)
OEplot(fit)
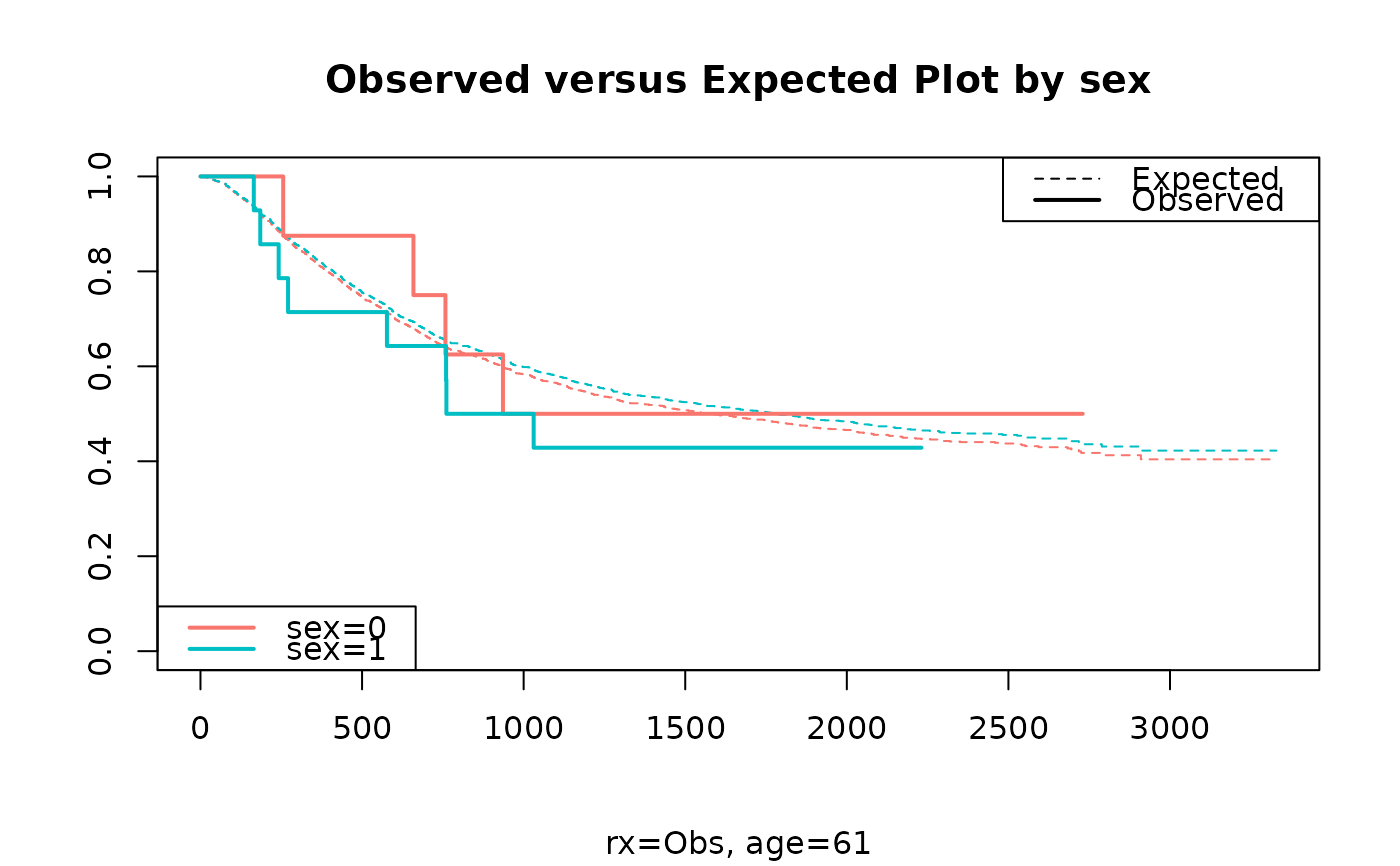
 OEplot(fit,xnames="sex")
 if (FALSE) { # \dontrun{
fit=coxph(Surv(time,status)~age,data=colon)
OEplot(fit)
fit=coxph(Surv(time,status)~logWBC,data=anderson)
OEplot(fit)
} # }
if (FALSE) { # \dontrun{
fit=coxph(Surv(time,status)~age,data=colon)
OEplot(fit)
fit=coxph(Surv(time,status)~logWBC,data=anderson)
OEplot(fit)
} # }