R/adjustedPlot.R
adjustedPlot2.Rd
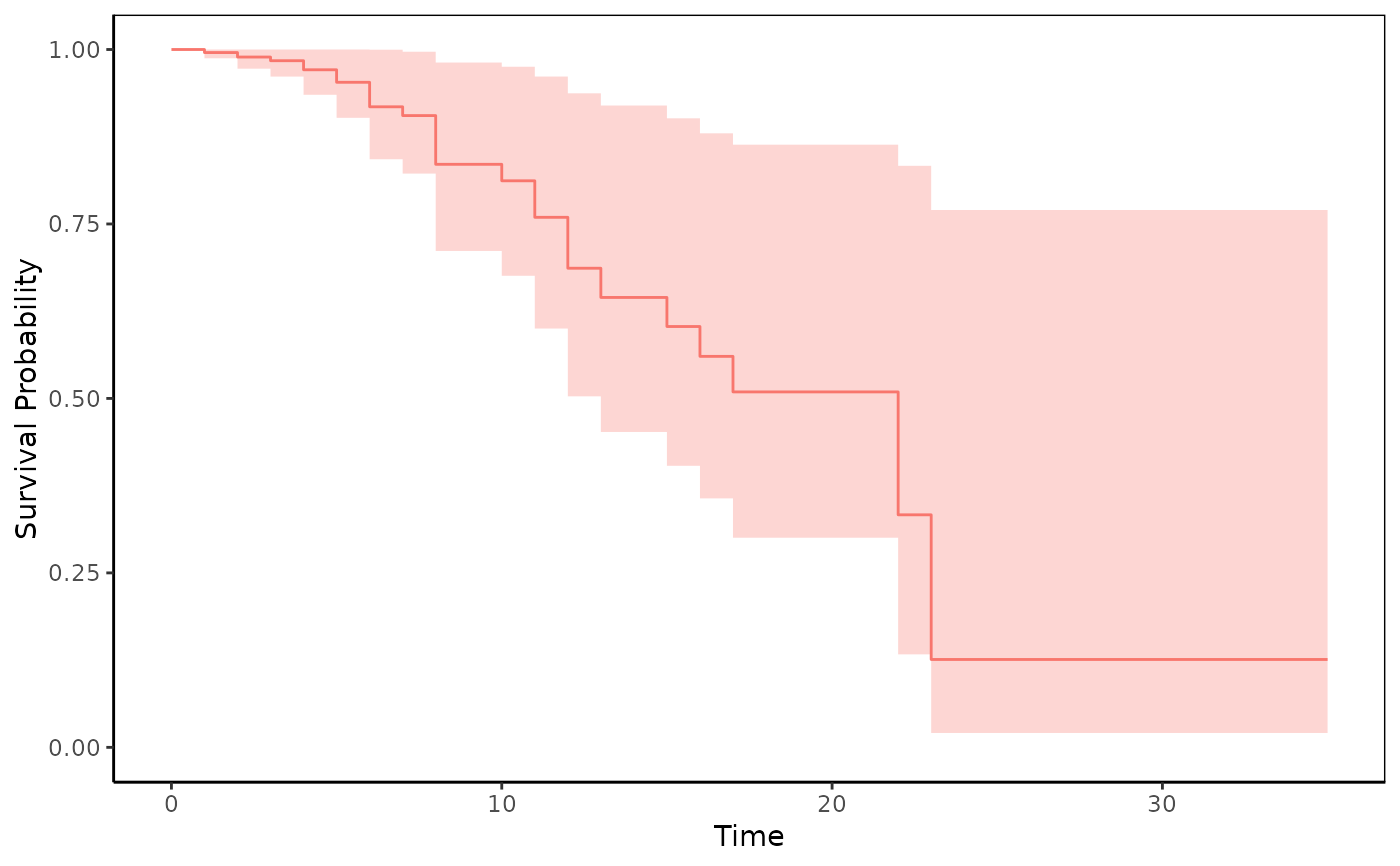
Draw a survfitted plot
adjustedPlot2(fit, se = FALSE, mark.time = FALSE)
An object of class coxph or survfit
logical Whether or not show se
logical Whether or not mark time
a ggplot
library(survival)
fit=coxph(Surv(time,status)~rx+logWBC,data=anderson)
plot(survfit(fit),conf.int=TRUE)

adjustedPlot2(fit,se=TRUE)