Draw predicted survival curve as a ggplot with an object survreg
Source:R/adjustedPlot2.survreg.R
adjustedPlot2.survreg.RdDraw predicted survival curve as a ggplot with an object survreg
Usage
adjustedPlot2.survreg(
  x,
  xnames = NULL,
  pred.values = list(),
  maxy.lev = 5,
  newdata = NULL,
  addCox = FALSE,
  autovar = TRUE,
  legend.position = NULL,
  facet = NULL
)
Arguments
- x
An object of class survreg
- xnames
Character Names of explanatory variable to plot
- pred.values
A list A list of predictor values
- maxy.lev
Integer Maximum unique length of a numeric variable to be treated as categorical variables
- newdata
A data.frame or NULL
- addCox
logical Whether or not add KM
- autovar
logical
- legend.position
Character Default value is "topright"
- facet
Character name(s) of facet variable(s)
Examples
library(survival)
x=survreg(Surv(time, status) ~ rx, data=anderson,dist="exponential")
adjustedPlot(x,type="plot")
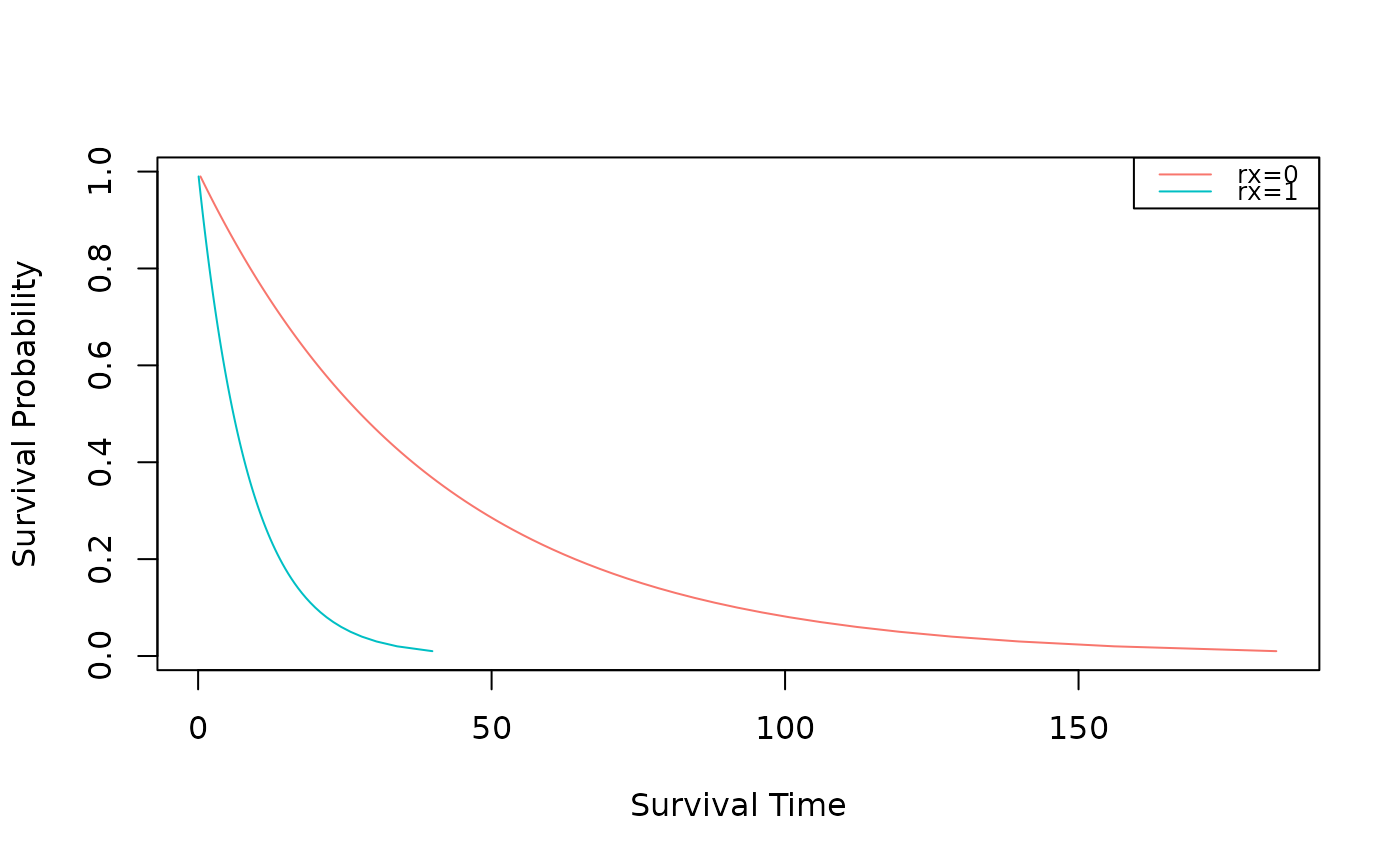 adjustedPlot(x)
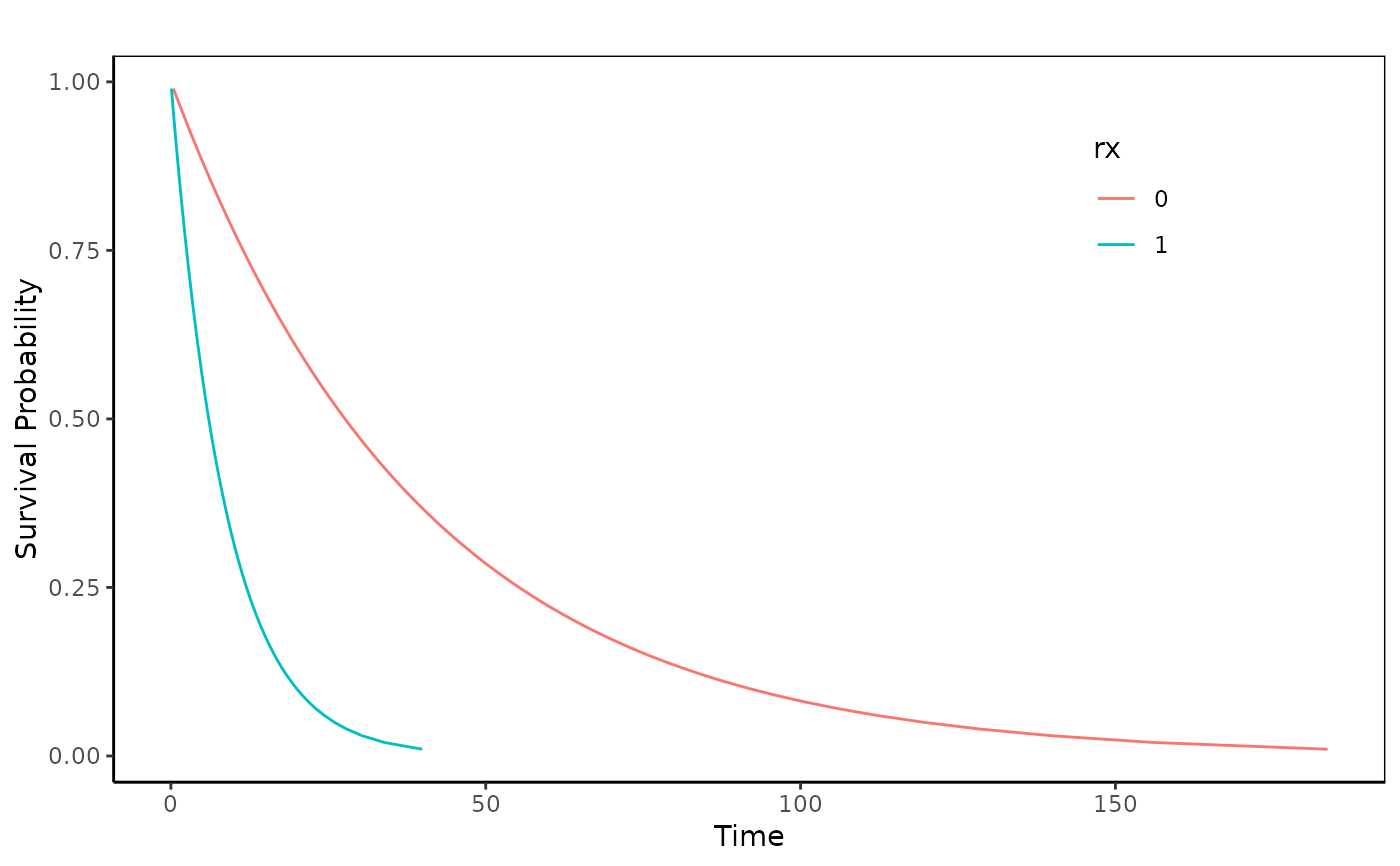
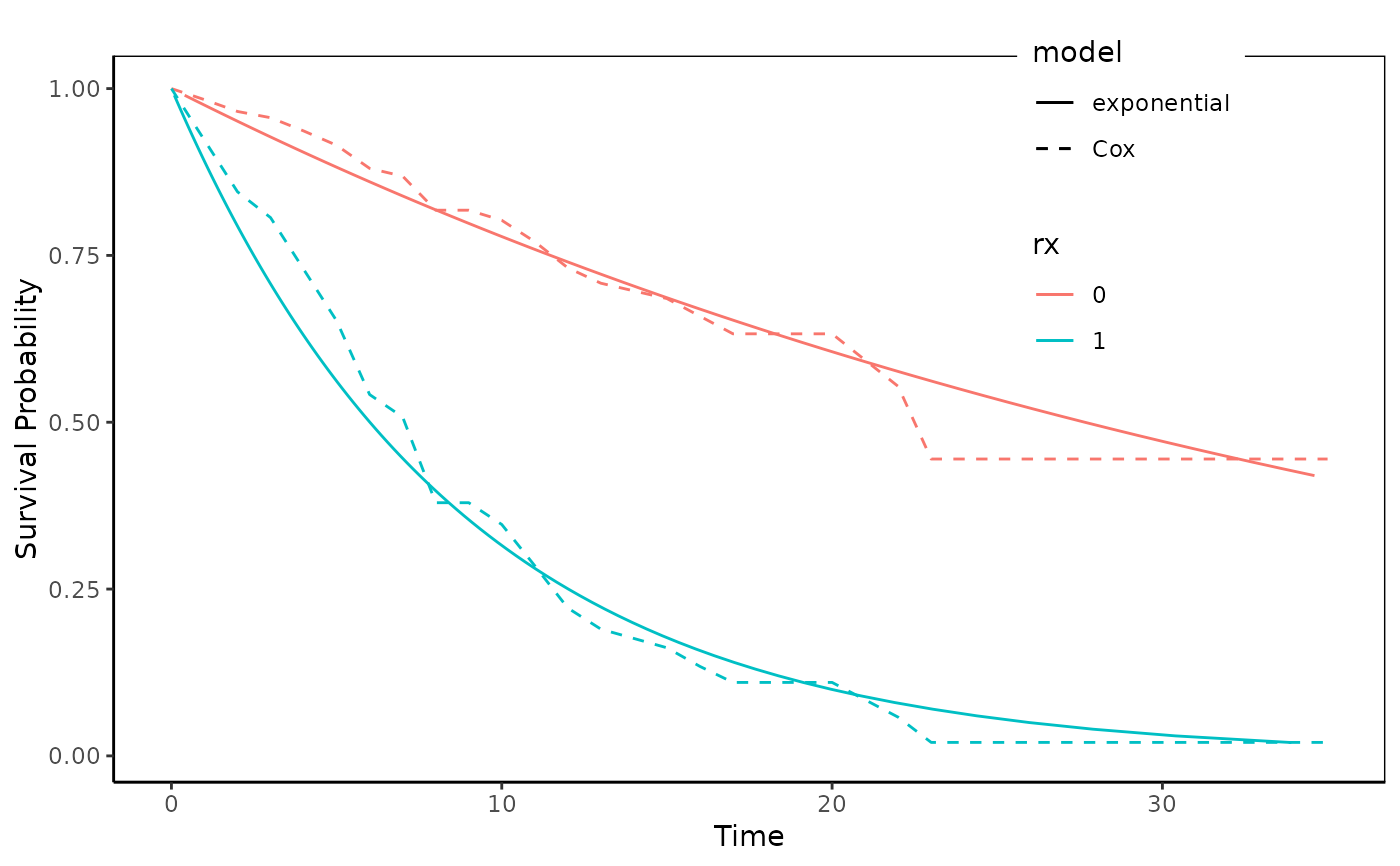
 adjustedPlot(x,addCox=TRUE)
#> Warning: Removed 42 rows containing missing values or values outside the scale range
#> (`geom_line()`).
adjustedPlot(x,addCox=TRUE)
#> Warning: Removed 42 rows containing missing values or values outside the scale range
#> (`geom_line()`).
 if (FALSE) { # \dontrun{
x=survreg(Surv(time, status) ~ sex, data=lung,dist="weibull")
adjustedPlot(x,addCox=TRUE)
x=survreg(Surv(time, status) ~ rx, data=anderson,dist="exponential")
adjustedPlot(x,addCox=TRUE)
x=survreg(Surv(time, status) ~ ph.ecog + age + sex, data=lung, dist="weibull")
pred.values=list(ph.ecog=0:3,sex=1:2,age=c(20,40,60,80))
adjustedPlot(x)
adjustedPlot(x,addCox=TRUE)
adjustedPlot(x,addCox=TRUE,xnames=c("ph.ecog","sex"),facet="sex")
adjustedPlot(x,pred.values=pred.values,addCox=TRUE,legend.position="top")+xlim(c(1,1000))
adjustedPlot(x,pred.values=pred.values,xnames=c("ph.ecog","sex","age"),facet=c("ph.ecog","sex"))
adjustedPlot(x,pred.values=pred.values,xnames=c("ph.ecog","sex","age"),facet=c("age","sex"))
adjustedPlot(x,pred.values=pred.values,addCox=TRUE)
adjustedPlot(x,addCox=TRUE)
adjustedPlot(x,pred.values=list(age=c(20,40,60,80),sex=1,ph.ecog=3),addCox=TRUE)
} # }
if (FALSE) { # \dontrun{
x=survreg(Surv(time, status) ~ sex, data=lung,dist="weibull")
adjustedPlot(x,addCox=TRUE)
x=survreg(Surv(time, status) ~ rx, data=anderson,dist="exponential")
adjustedPlot(x,addCox=TRUE)
x=survreg(Surv(time, status) ~ ph.ecog + age + sex, data=lung, dist="weibull")
pred.values=list(ph.ecog=0:3,sex=1:2,age=c(20,40,60,80))
adjustedPlot(x)
adjustedPlot(x,addCox=TRUE)
adjustedPlot(x,addCox=TRUE,xnames=c("ph.ecog","sex"),facet="sex")
adjustedPlot(x,pred.values=pred.values,addCox=TRUE,legend.position="top")+xlim(c(1,1000))
adjustedPlot(x,pred.values=pred.values,xnames=c("ph.ecog","sex","age"),facet=c("ph.ecog","sex"))
adjustedPlot(x,pred.values=pred.values,xnames=c("ph.ecog","sex","age"),facet=c("age","sex"))
adjustedPlot(x,pred.values=pred.values,addCox=TRUE)
adjustedPlot(x,addCox=TRUE)
adjustedPlot(x,pred.values=list(age=c(20,40,60,80),sex=1,ph.ecog=3),addCox=TRUE)
} # }