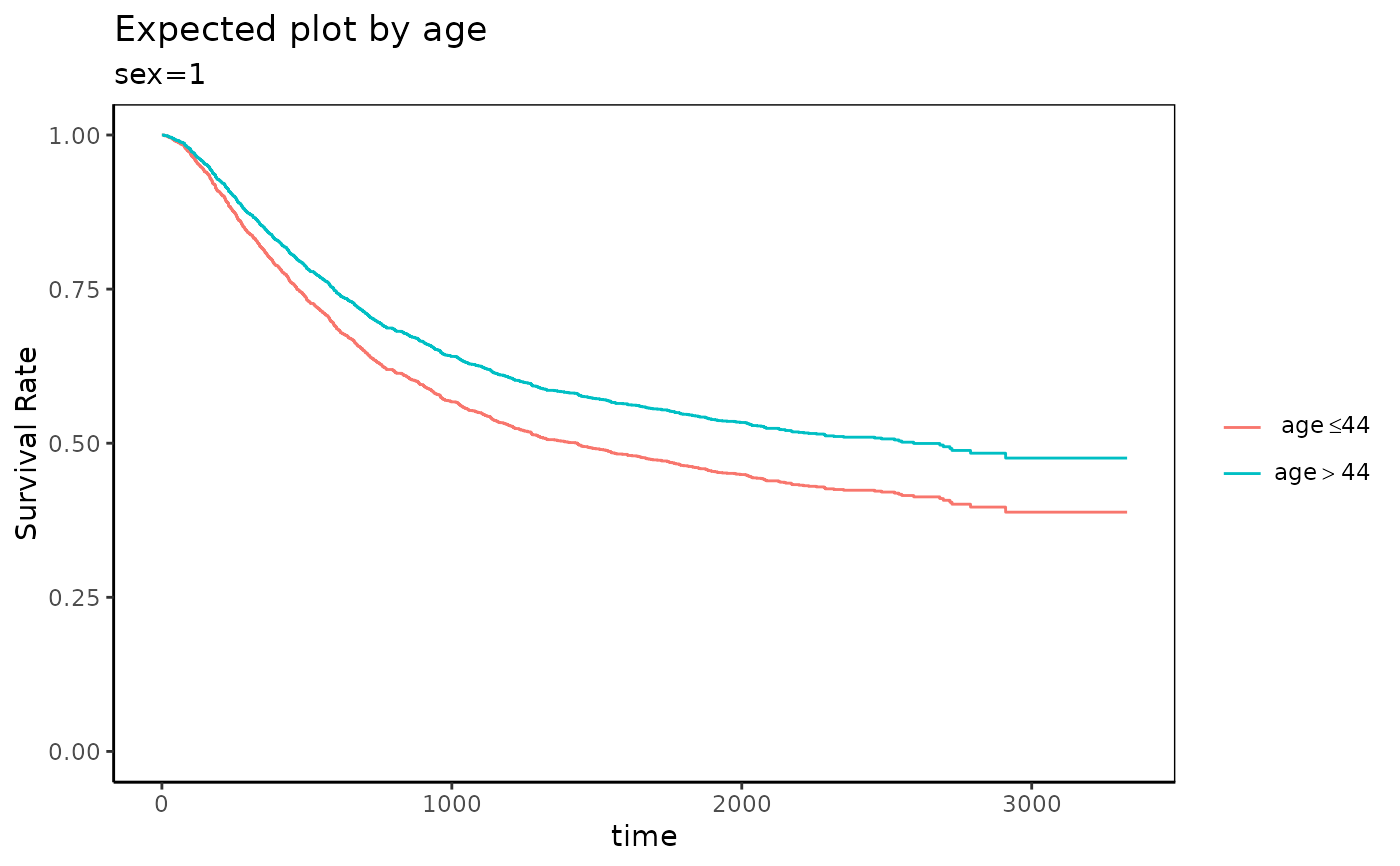
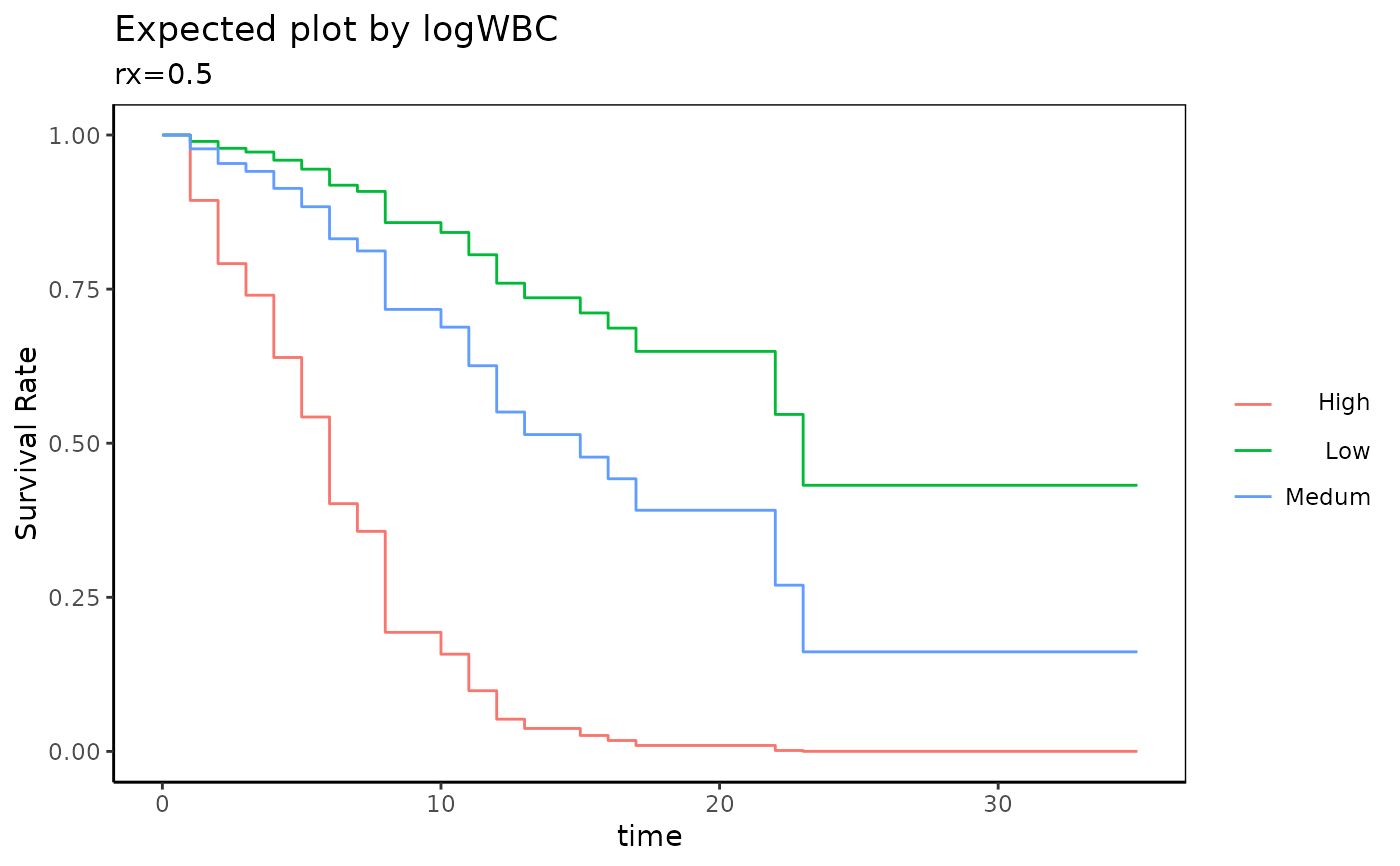
Select cutpoint for a numeric predictor with maxstat.test() and draw survival plot with this cutpoint
Usage
expectedPlot(
  fit,
  xname = NULL,
  no = 2,
  maxy.lev = 5,
  median = TRUE,
  mark.time = FALSE,
  se = FALSE,
  type = "ggplot",
  ...
)
Arguments
- fit
An object of class "coxph"
- xname
Character Name of explanatory variable to plot
- no
integer Number of groups to be made
- maxy.lev
Integer Maximum unique length of a numeric variable to be treated as categorical variables
- median
Logical
- mark.time
logical Whether or not mark time
- se
logical Whether or not show se
- type
Character "plot" or "ggplot"
- ...
further arguments to be passed to plot.survfit