Draw normal distribution curve
Usage
draw_n(mean = 0, sd = 1, z = NULL, p = 0.05, alternative = "two.sided")
Arguments
- mean
vector of means
- sd
vector of standard deviations
- z
vector of quantiles
- p
vector of probabilities
- alternative
a character string specifying the alternative hypothesis,
must be one of "two.sided" (default), "greater" or "less".
Examples
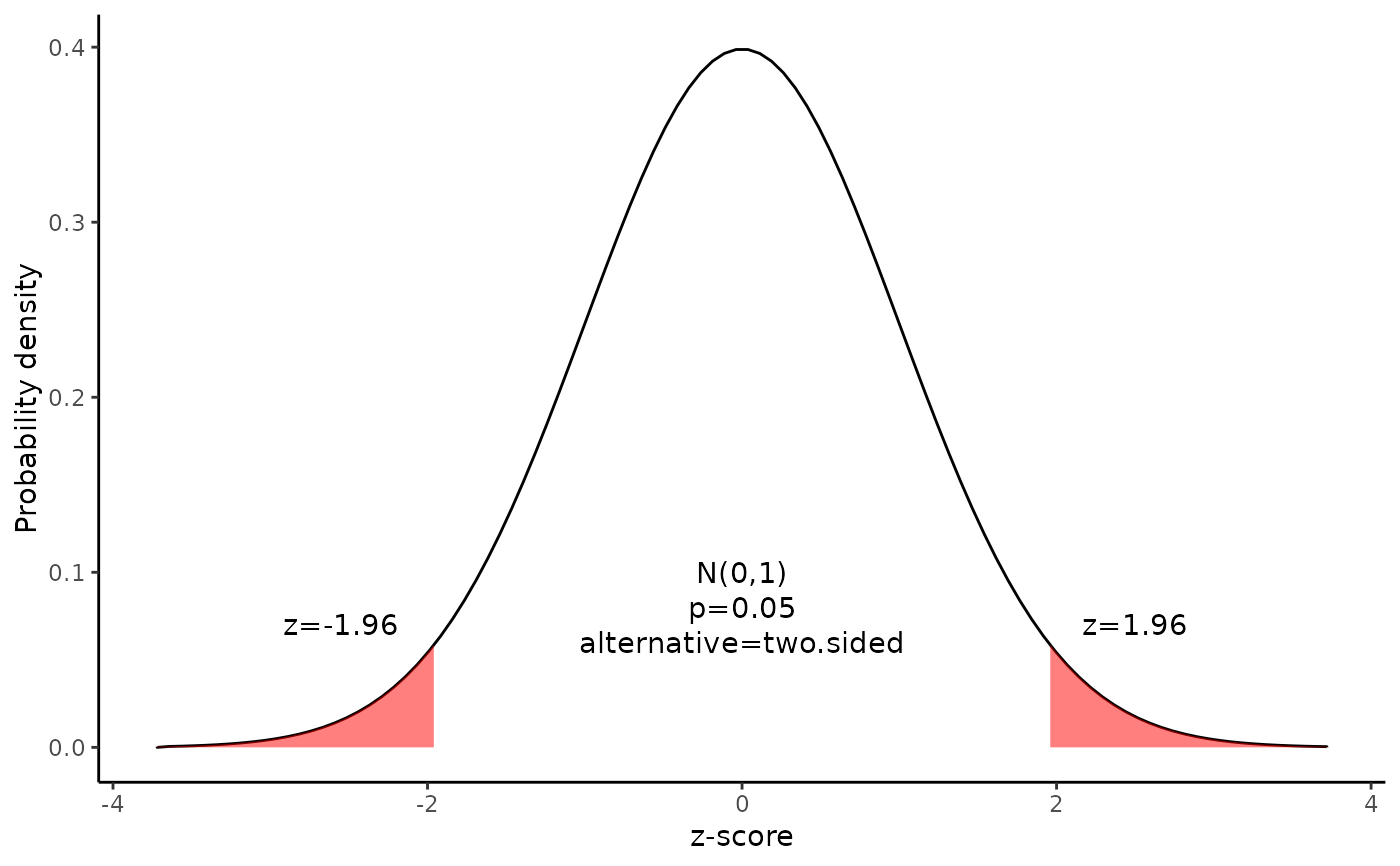
draw_n()
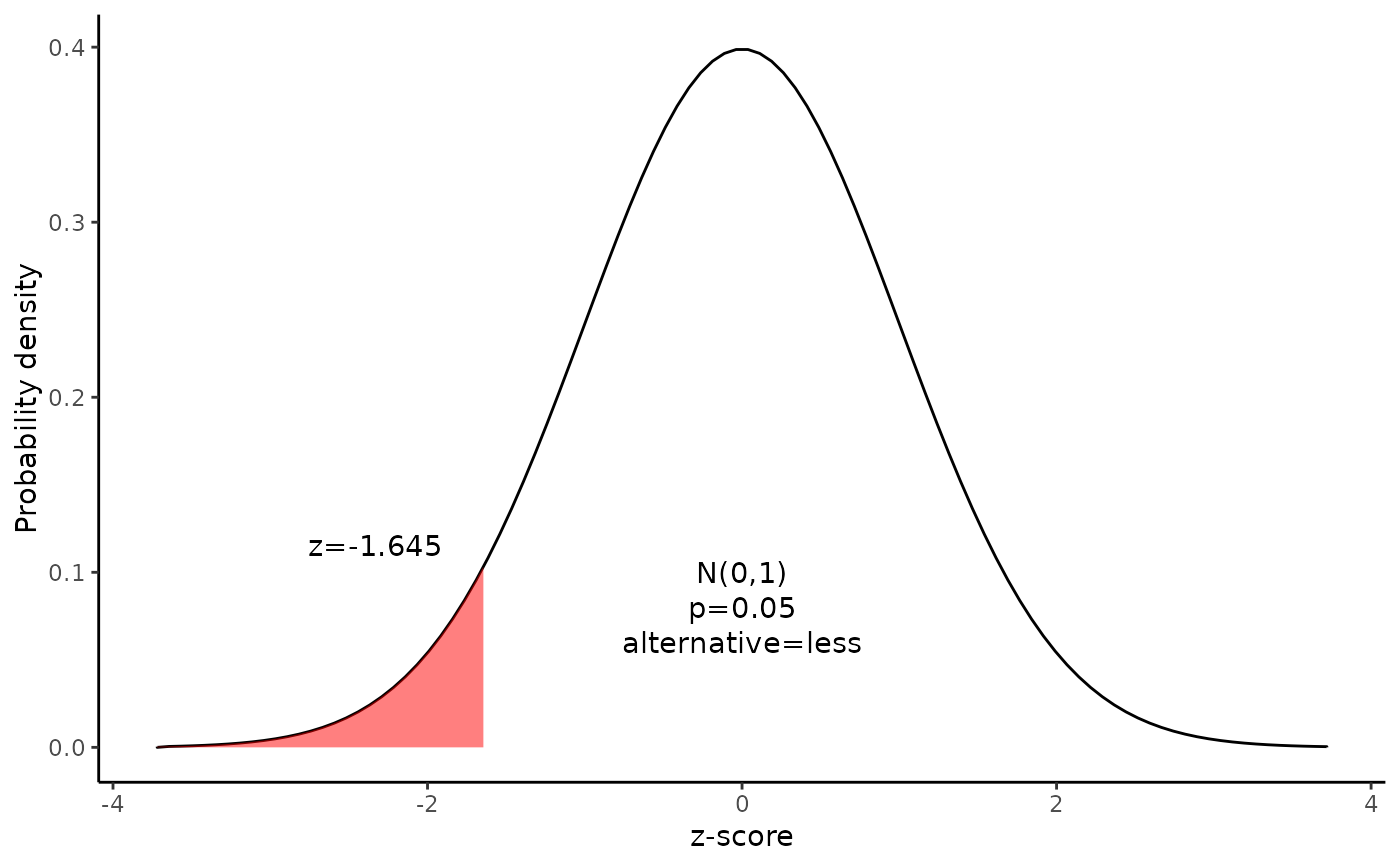
 draw_n(alternative="less")
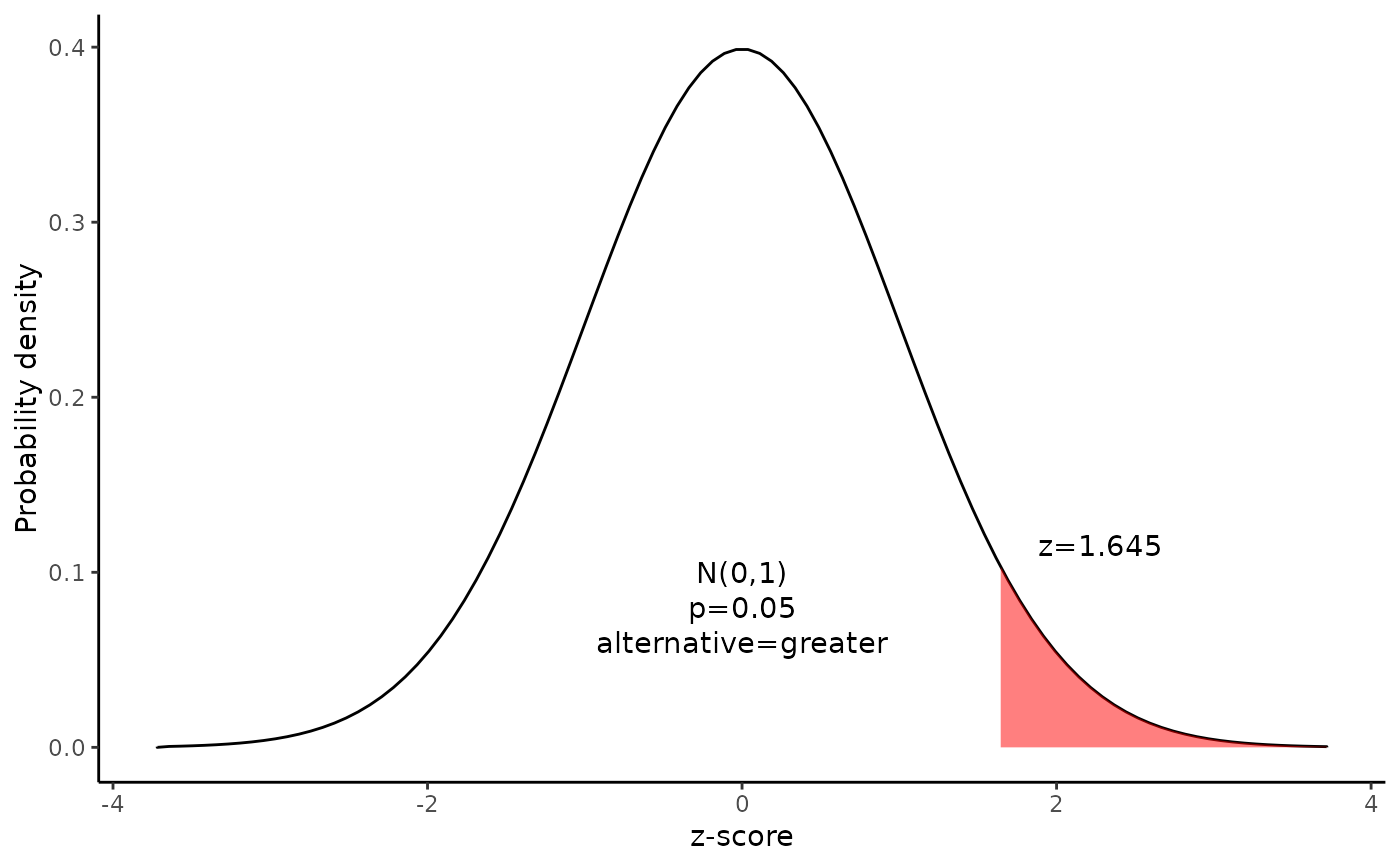
 draw_n(alternative="greater")
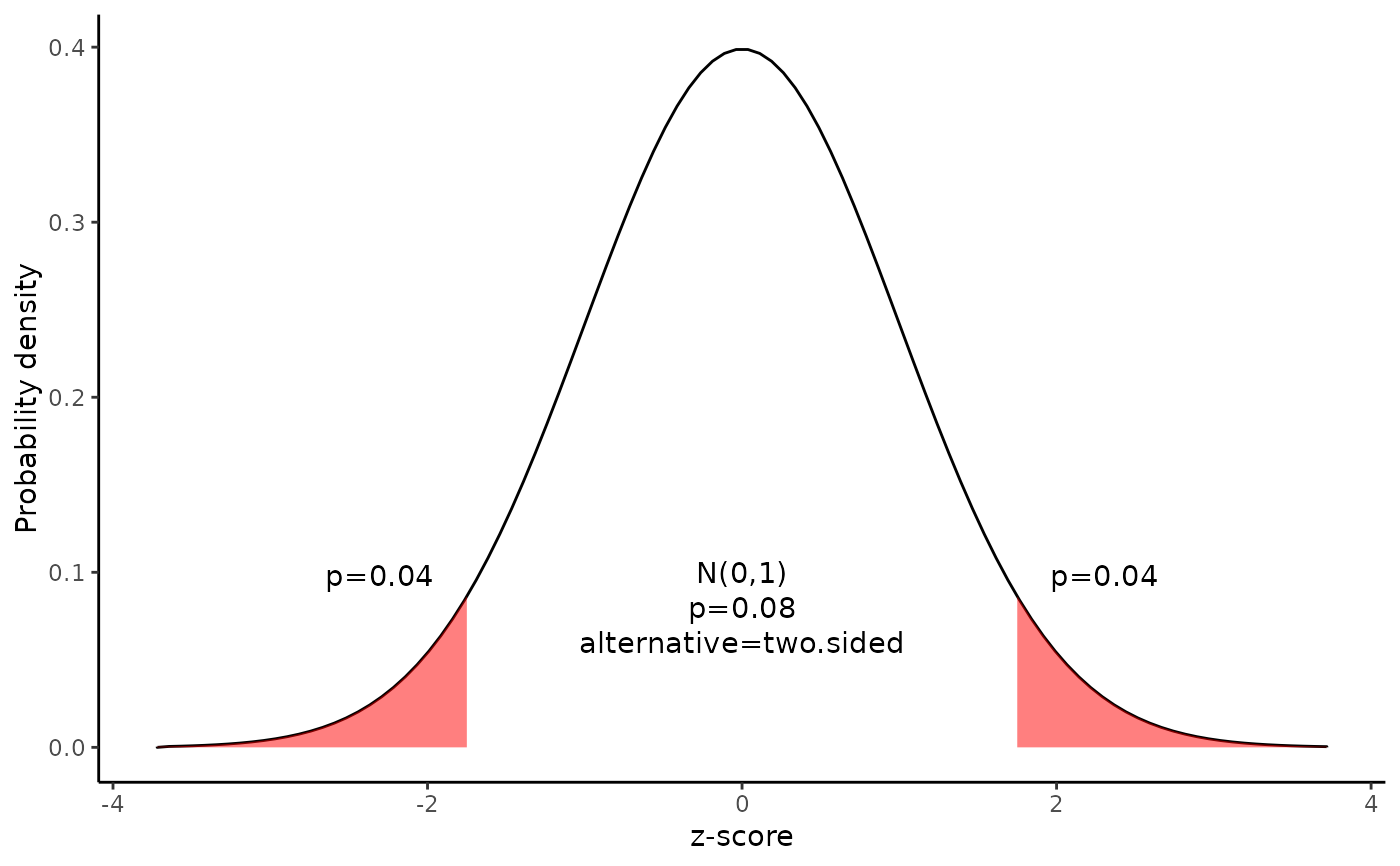
 draw_n(z=-1.75)
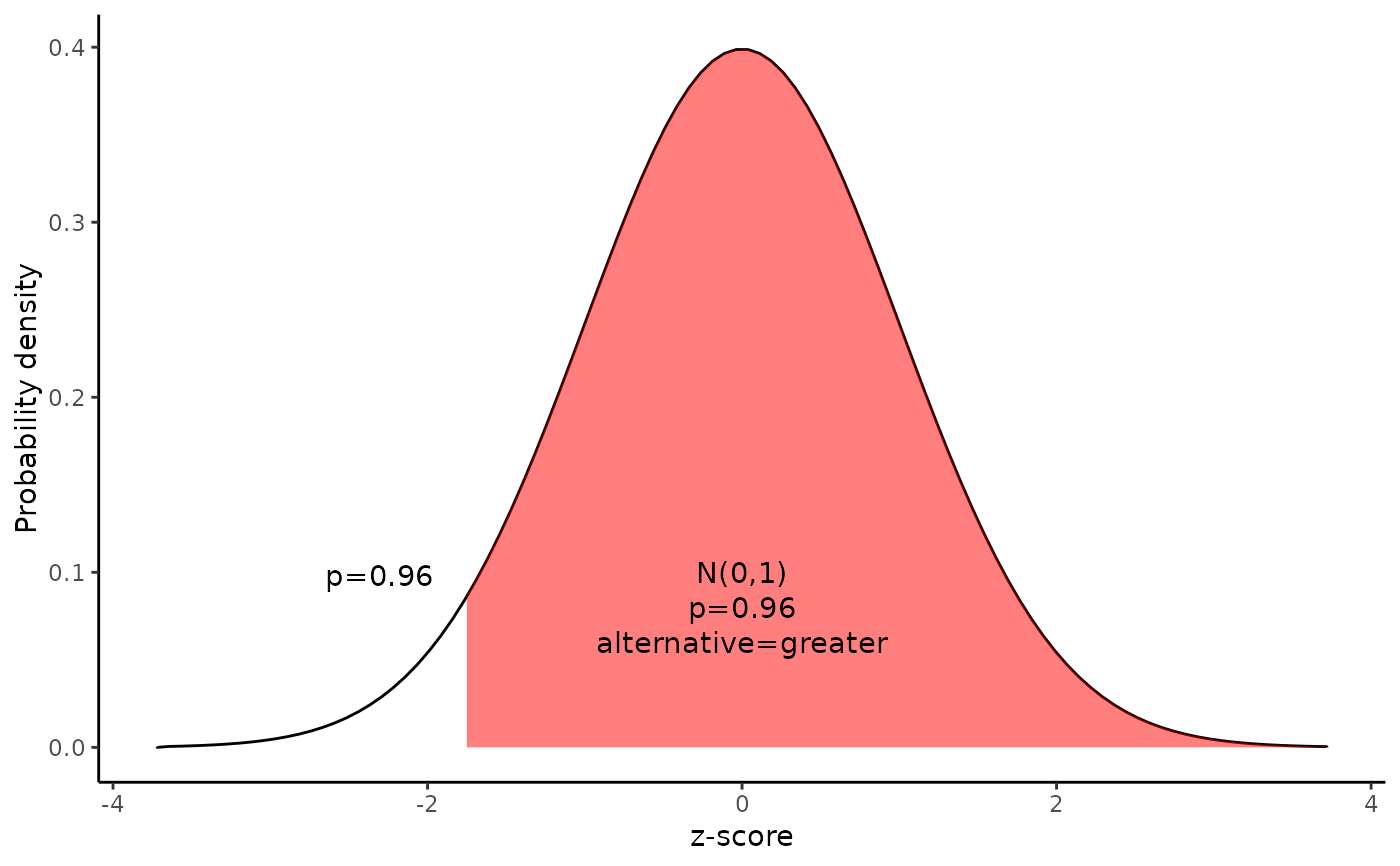
 draw_n(z=-1.75,alternative="greater")
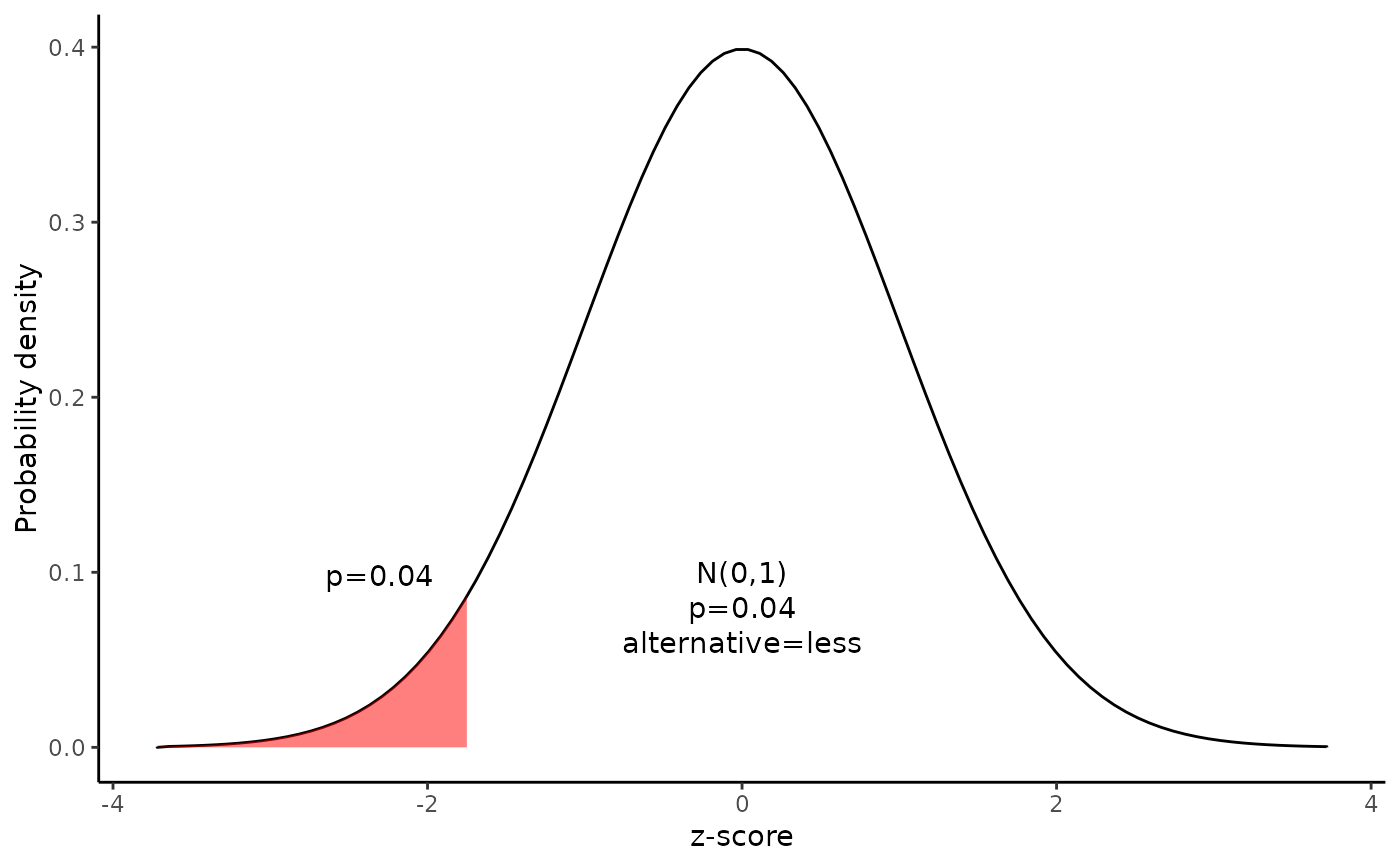
 draw_n(z=-1.75,alternative="less")