R/draw_x2.R
draw_x2.Rd
Draw chi-squared distribution curve
draw_x2(q = NULL, p = 0.05, df = 2)
vector of quantiles
vector of probabilities
degrees of freedom (non-negative, but can be non-integer).
A ggplot
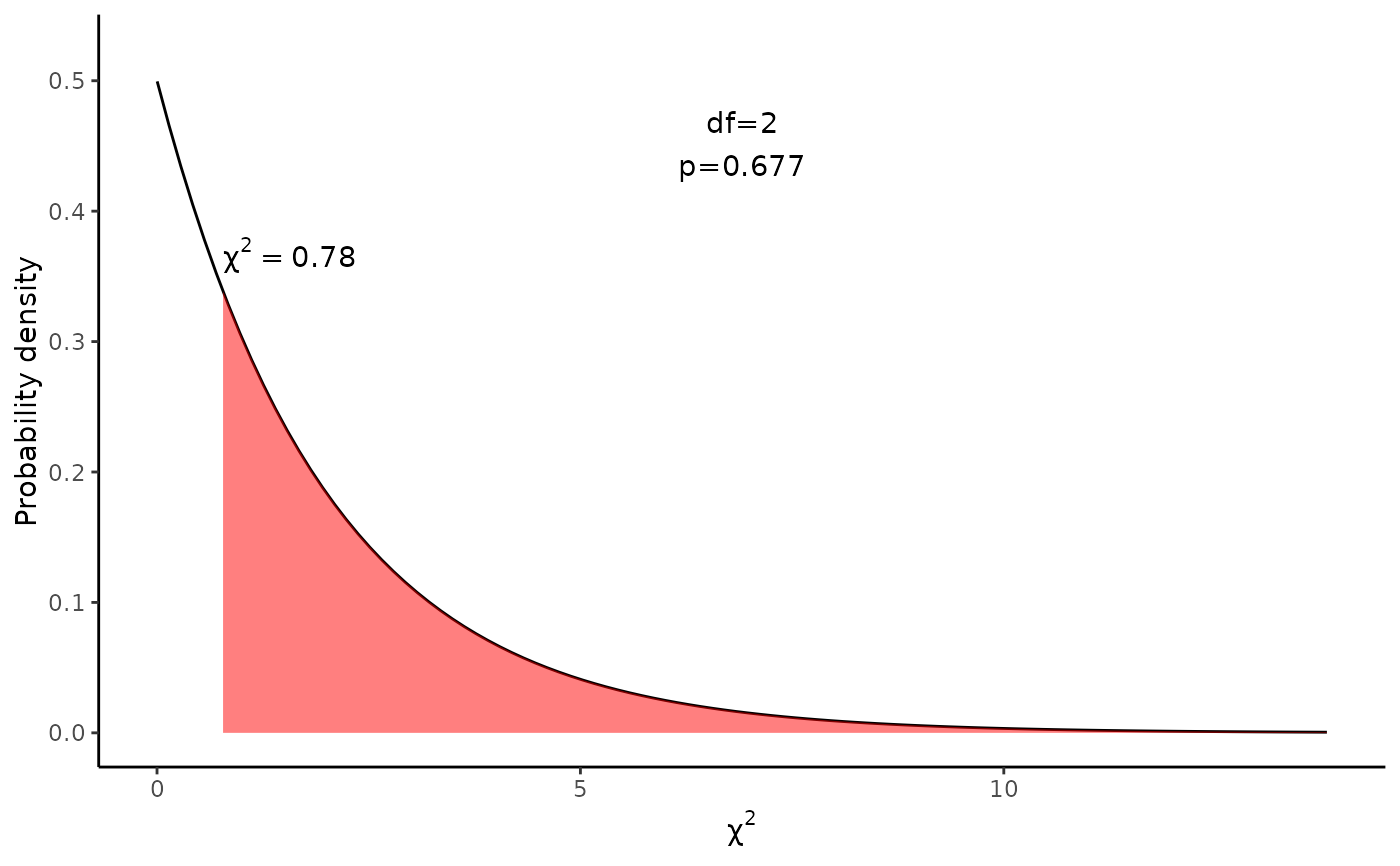
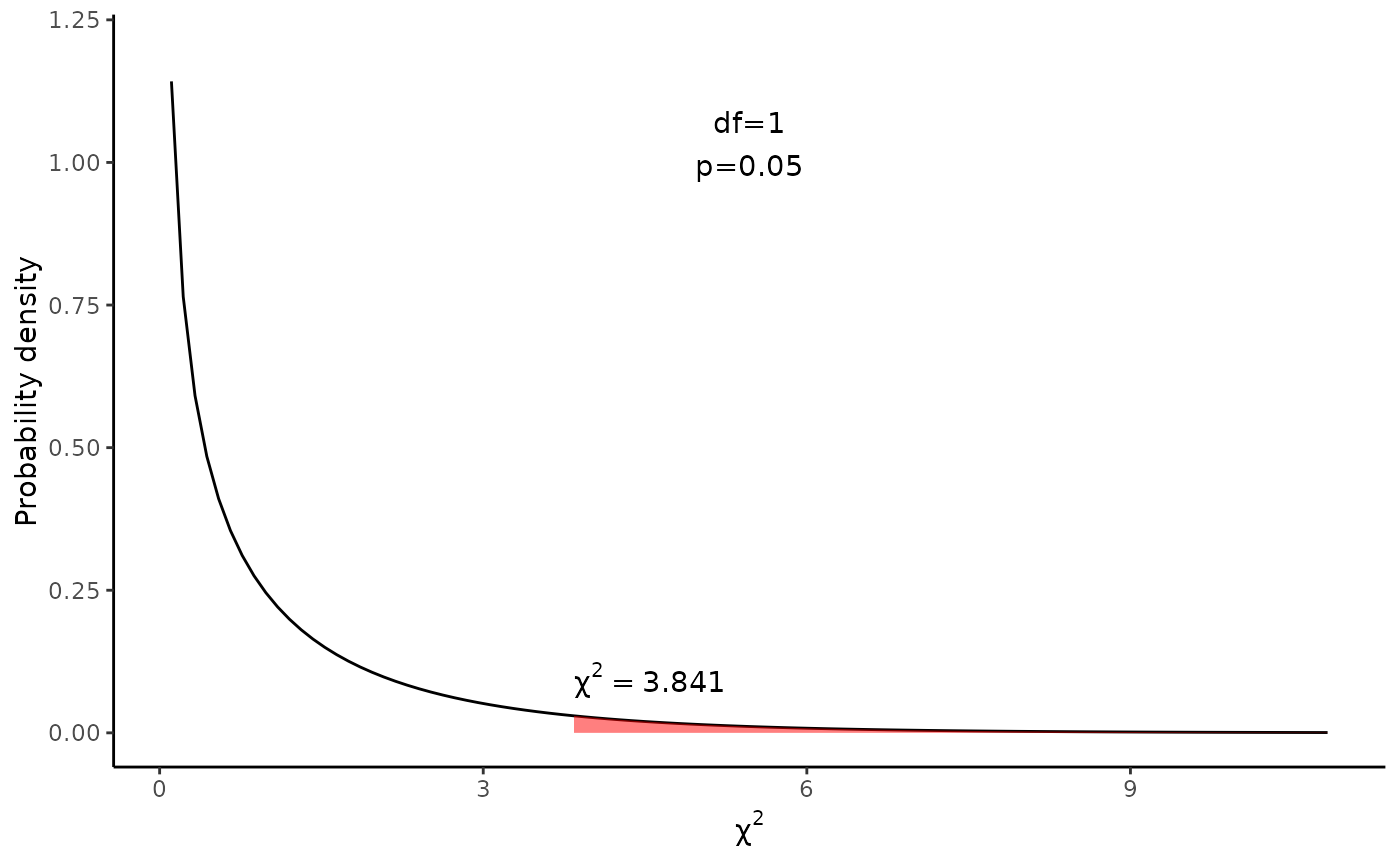
draw_x2(df=1)

draw_x2(q=0.78)
 draw_x2(q=0.78)