R/plot.meanCI.R
meanCIplot1.Rd
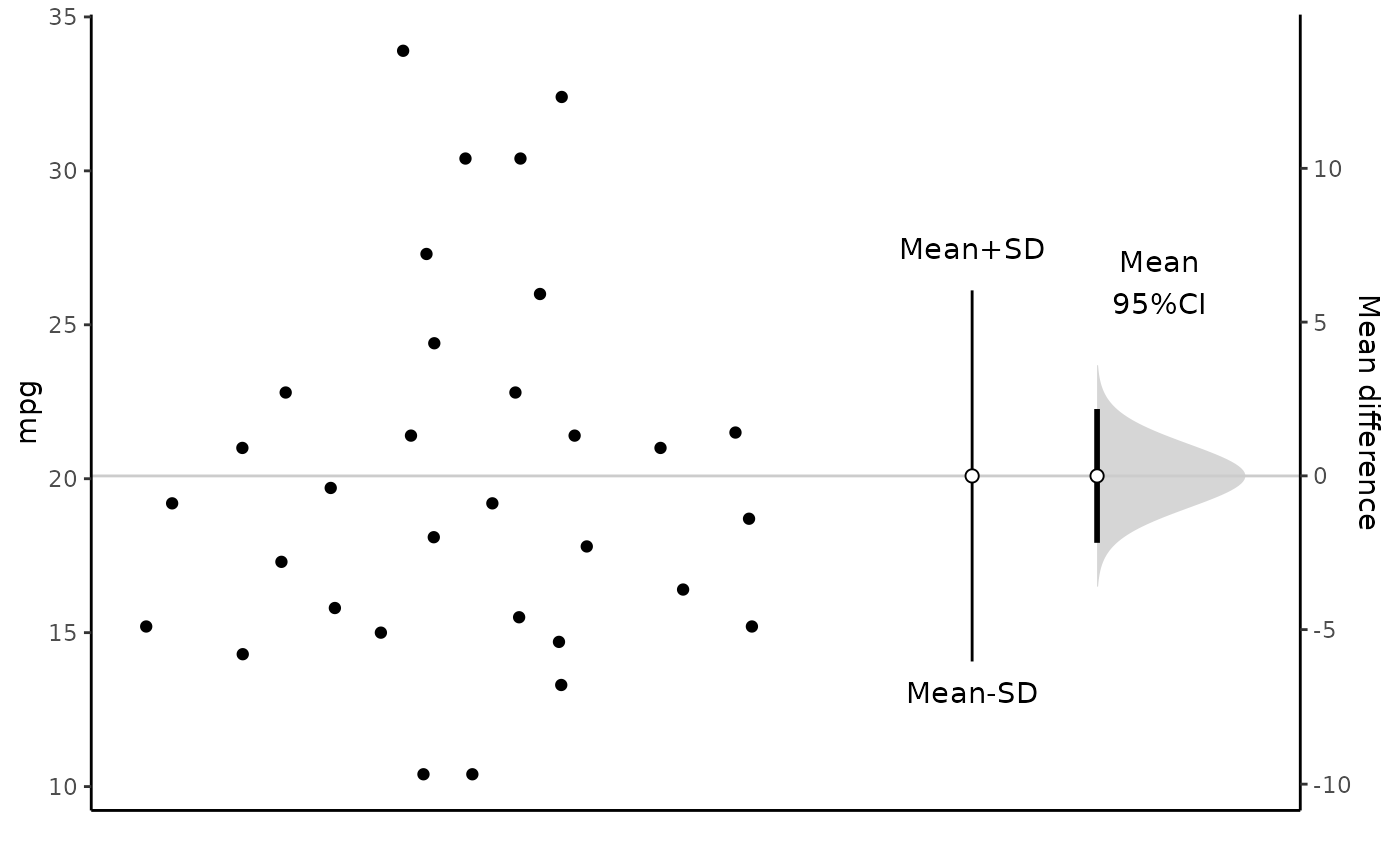
Draw meanCI plot for data with single vector
meanCIplot1(x)
An object of class "meanCI" with attr(x,"measure")=="mean"
A ggplot
x=meanCI(mtcars,mpg)
meanCIplot1(x)