Draw a pair plot with an object of class meanCI
Usage
pairPlot(x, palette = NULL)
Arguments
- x
An object of class "meanCI" with attr(x,"measure")=="paired"
- palette
The name of color palette from RColorBrewer package or NULL
Examples
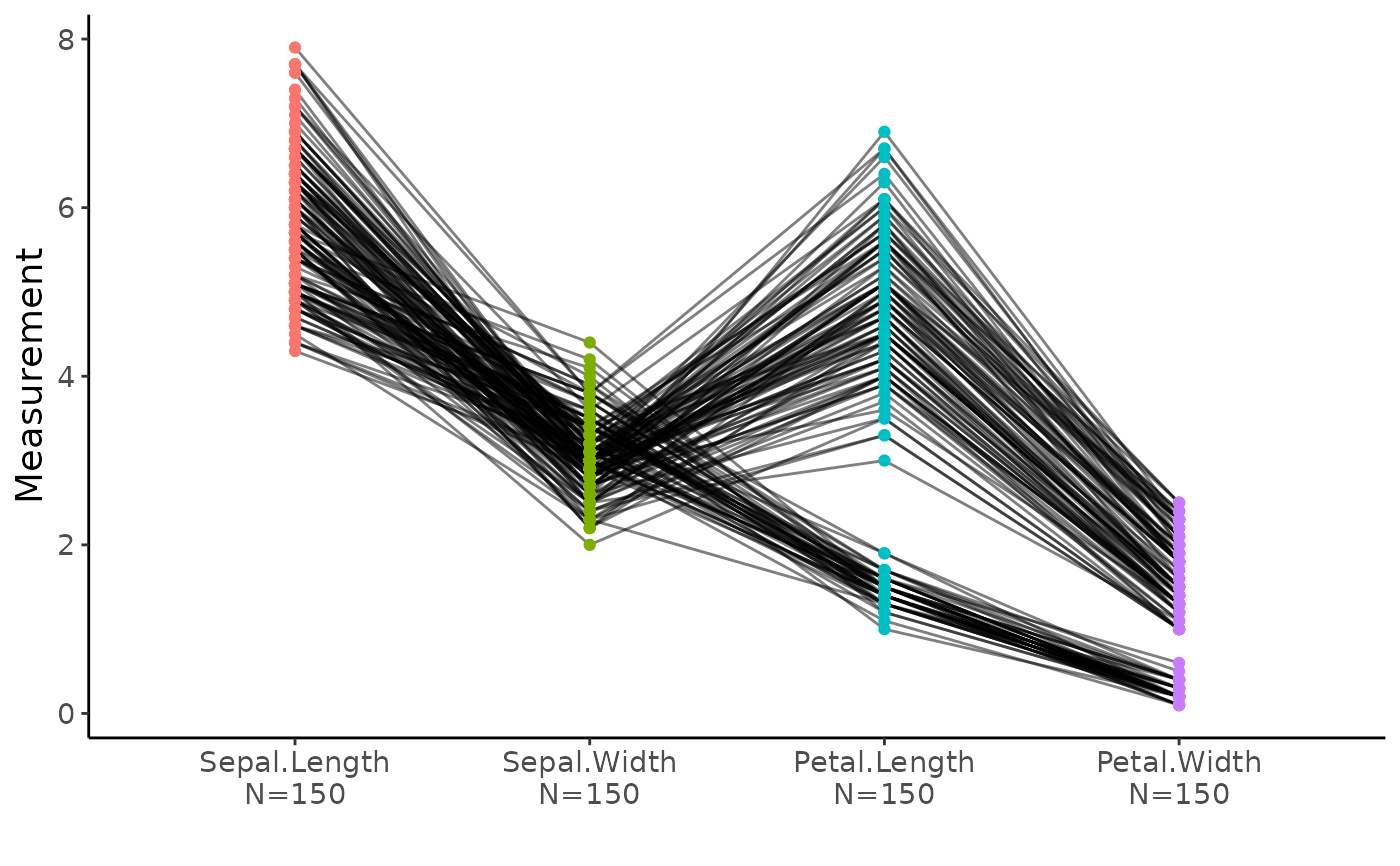
x=meanCI(iris,paired=TRUE)
pairPlot(x)
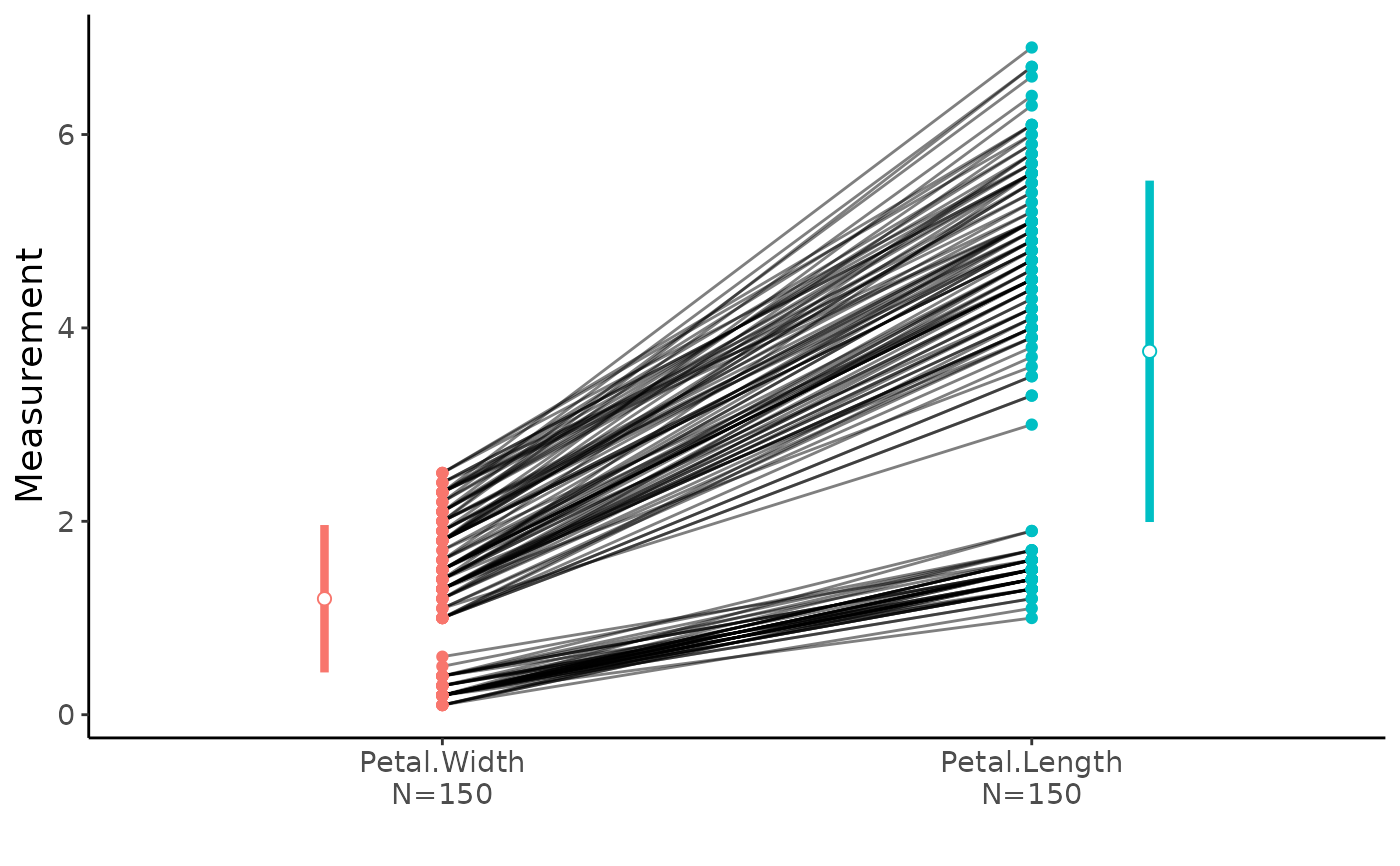
 x=meanCI(iris,Petal.Width, Petal.Length,paired=TRUE)
pairPlot(x)
x=meanCI(iris,Petal.Width, Petal.Length,paired=TRUE)
pairPlot(x)