R/plot.meanCI.R
pairPlot1.Rd
Draw a pair plot
pairPlot1(data, ref = NULL, palette = NULL)
a data.frame
Numeric or NULL
The name of color palette from RColorBrewer package or NULL
A ggplot
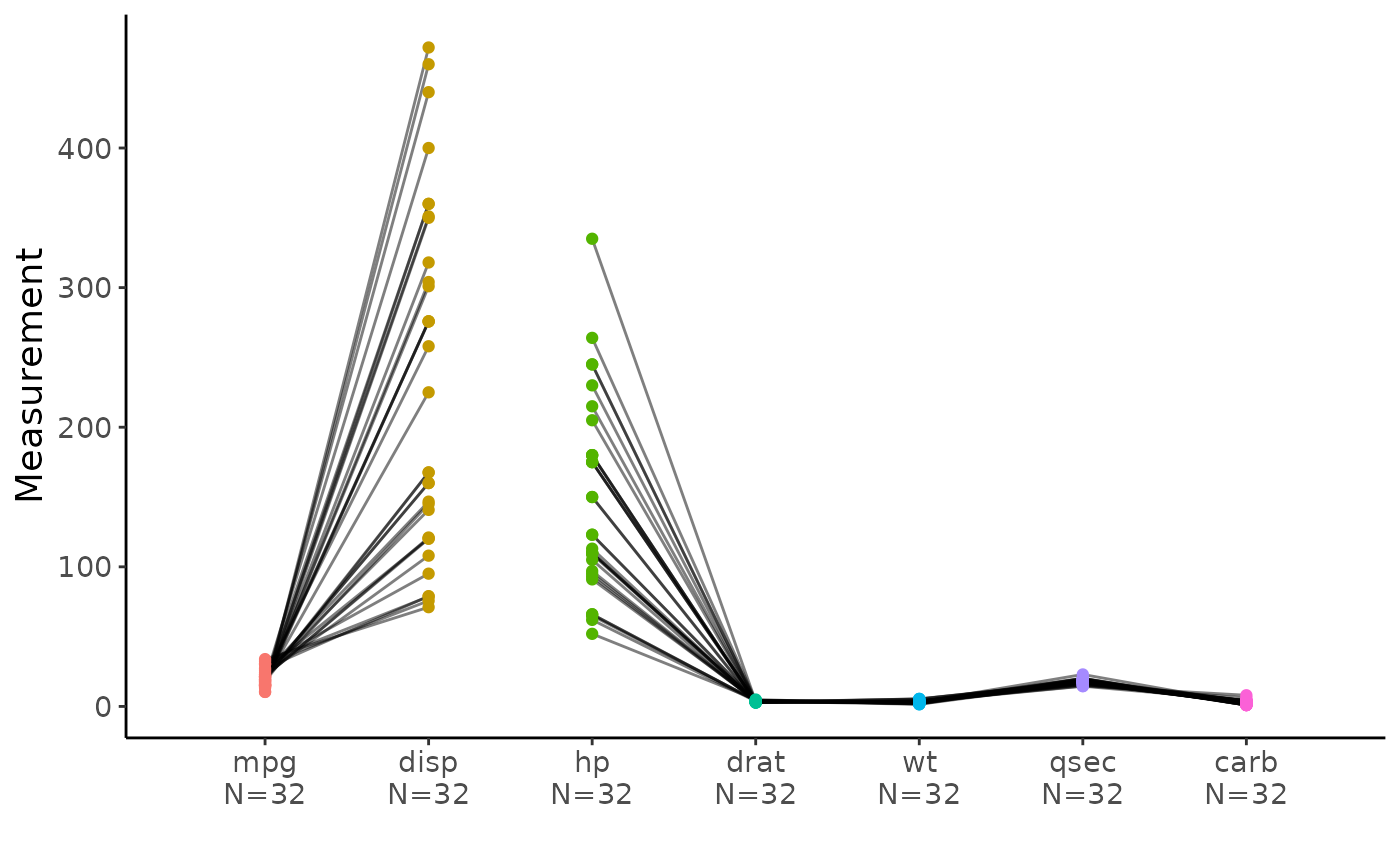
x=meanCI(mtcars,paired=TRUE)
pairPlot1(x$data)

pairPlot1(x$data,ref=c(1,4,6))

pairPlot1(x$data,ref=c(1,3))
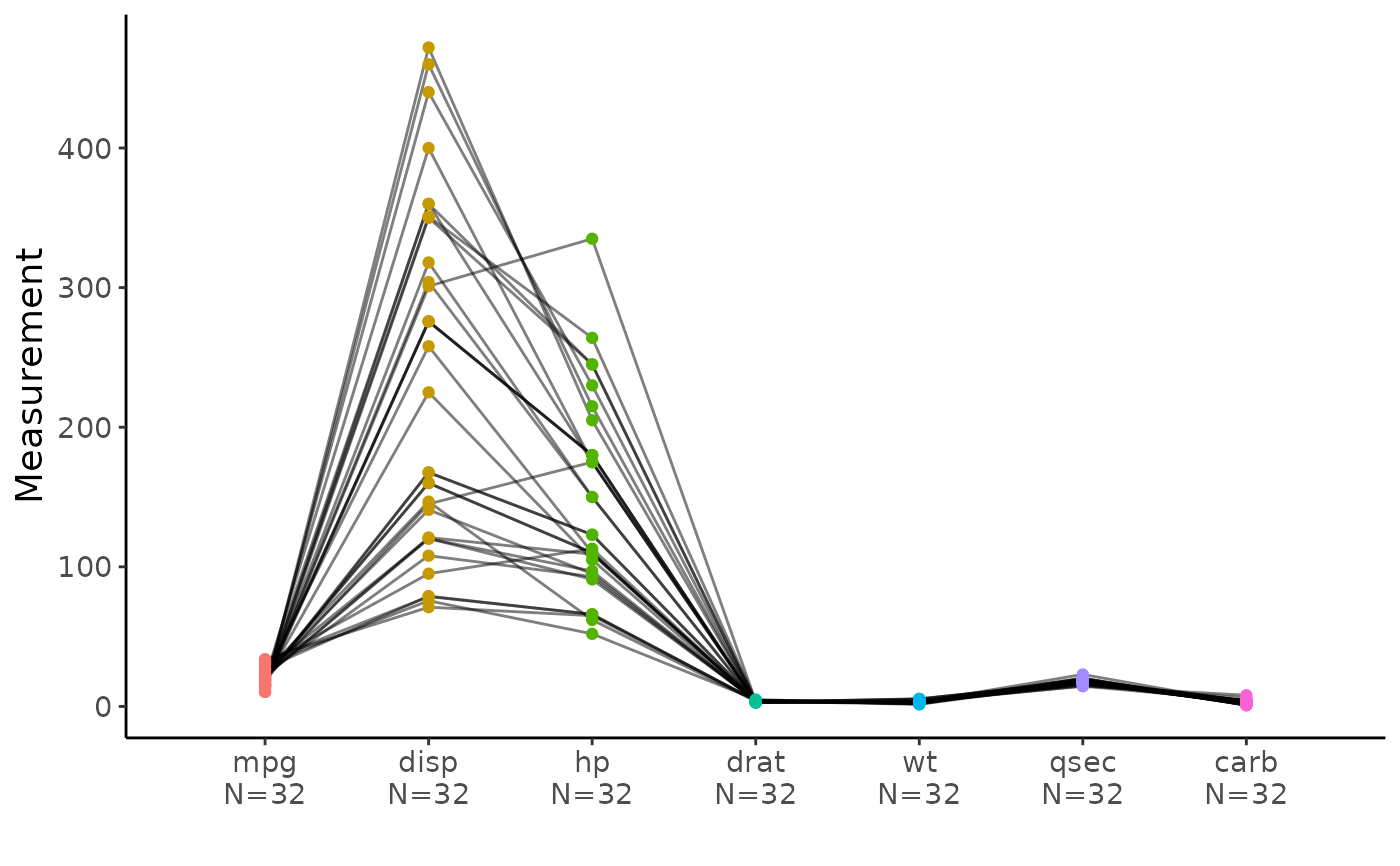 pairPlot1(x$data,ref=c(1,4,6))
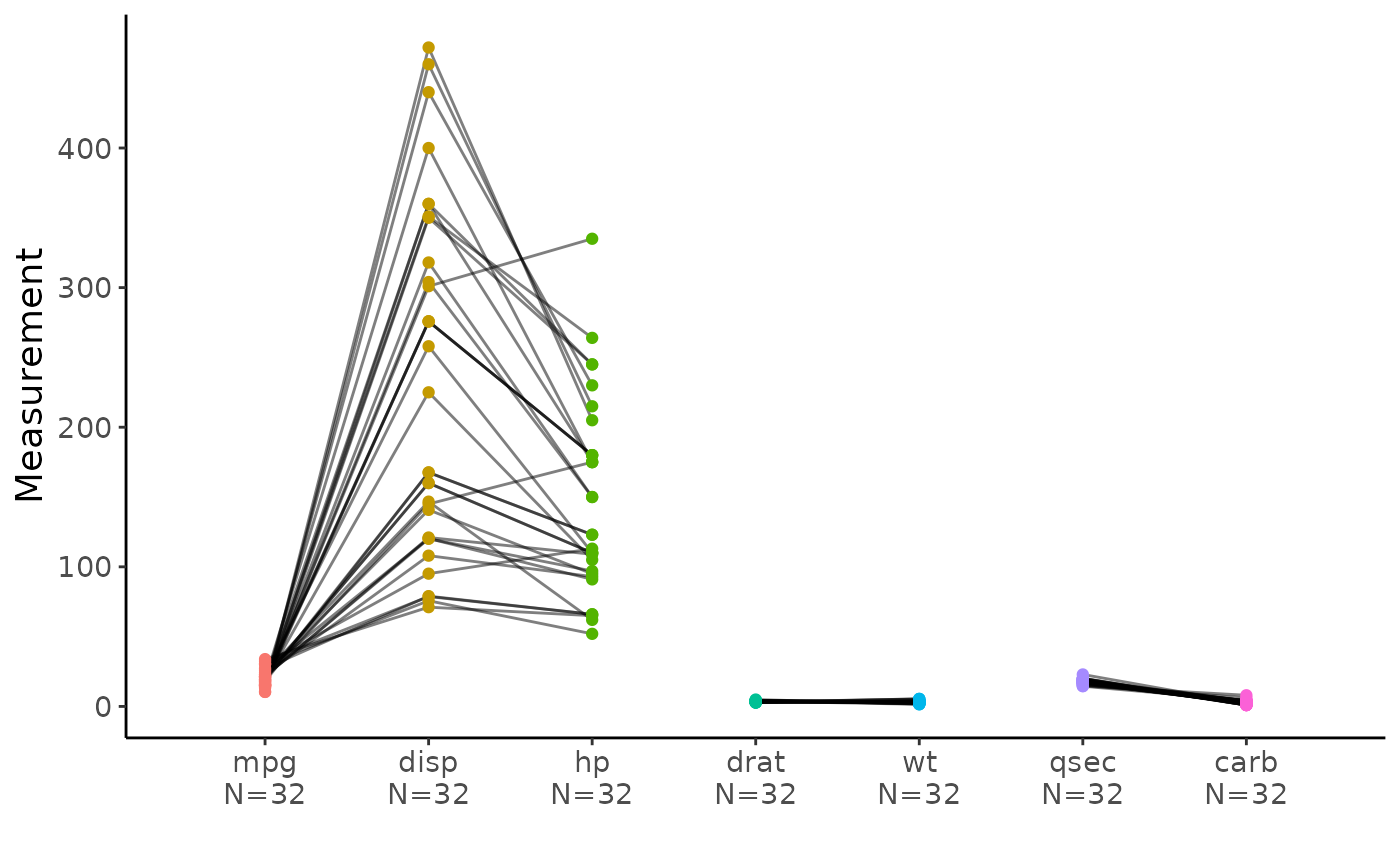 pairPlot1(x$data,ref=c(1,3))